Supporting Clinical MaterialValidation & Performance DataReview the technical performance details, then return to the provider page when you are ready to continue.
Clinical and analytical performance summary for plasma p-Tau217.
Page 1 of 3
Evidence-led clinician reference
Clinical performance, reference range, precision, linearity, stability, and interference results are summarized below using the reported study data.
Summary
This report summarizes the clinical and analytical performance of plasma p-Tau217, including assay accuracy, normal reference range, analytical measurement interval, intra- and inter-laboratory precision, admixture linearity, sample stability, and interference.
Background
Alzheimer's disease (AD) is characterized by extracellular amyloid plaques and intraneuronal neurofibrillary tangles composed of phosphorylated tau (p-Tau) in the brain. Under normal conditions, the tau protein regulates microtubule assembly and helps maintain neuronal axon stability; excessive phosphorylation of tau can contribute to pathology.
In AD, soluble p-Tau accumulates in the cerebrospinal fluid (CSF) and can be measured by lumbar puncture. Sensitive blood-based methods can also measure p-Tau in plasma, and plasma p-Tau217 correlates with amyloid PET imaging as a screening aid for amyloid pathology in cognitively impaired individuals.
Method
The reported assay is a digital immunoassay designed for precise quantitation of p-Tau217 in human EDTA-plasma samples using a high-sensitivity automated analyzer.
The data summarized in this report were generated under CLIA high-complexity laboratory standards and CLSI-aligned study protocols.
Clinical performance
The study cohort was predominately female (60%) and primarily White ethnicity (86%), with smaller proportions of Black, Asian/Pacific Islander, and Native American individuals. Additionally, 31% of the sample were carriers of the APOE e4 allele.
The cohort included dementia (n = 40), mild cognitive impairment (n = 109), normal cognitive function (n = 166), and other diagnoses (n = 2). All participants underwent amyloid PET evaluation; a positive scan was centiloid ≥ 24.
Table 2. p-Tau217 clinical performance
Value
Sample size (n)
317
Area under the curve (AUC)
0.94
Youden index / 95% sensitivity
0.34 ng/L
95% specificity
0.63 ng/L
Analytical Performance
Healthy samples, precision, and stability
Page 2 of 3
Reported values from study tables and figures
Healthy samples
Healthy aging amyloid PET-negative samples were sourced from the ABIL healthy aging study (n = 363). Subsequently, 8 outliers were removed using an outlier test, and CLSI EP28 guidelines were used to establish the normal reference range.
Table 3. Healthy control distribution metrics p-Tau217
Value
Mean
0.23 ng/L
Standard deviation
0.09 ng/L
97.5th percentile
0.46 ng/L
Measurement range
The analytical measurement interval ranged from 0.032 to 10 ng/L. The limit of blank, limit of detection, and low limit of quantification were determined in accordance with CLSI EP17 guidelines.
Sample stability
EDTA plasma stability was assessed across fresh blood-draws, room temperature, 2-8°C, -20°C, and -80°C conditions. Freeze/thaw stability was also evaluated following CLSI EP25 guidelines to characterize sample resilience during routine storage and handling.
37°C
up to 48 hours
15-25°C
up to 7 days
2-8°C
up to 7 days
-20°C
up to 4 weeks
-80°C
up to 8 months
Freeze-thaw
up to 5 cycles
Precision
Precision evaluations were conducted within and between runs, days, and operators, as well as within and between lots and across intra- and inter-laboratory settings using CLSI EP05 guidelines. Four pooled plasma samples were used to represent low (NC-20), low-mid (NC-30), mid (MC-40), and high (HC-120) concentration levels.
Table 4. p-Tau217 coefficient of variation (CV %)
Mean ± SD
N
Within run
Between day
Between operator
Intra-lab
Inter-lab
NC-20
0.29 ± 0.56 ng/L
54
5.6%
4.0%
5.4%
9.1%
10.4%
NC-30
0.51 ± 0.99 ng/L
53
2.7%
4.4%
8.4%
7.5%
10.4%
MC-40
0.83 ± 0.16 ng/L
54
1.6%
4.0%
5.5%
7.8%
9.6%
HC-120
2.23 ± 0.37 ng/L
54
1.9%
4.1%
2.4%
7.0%
9.9%
Intra-laboratory precision was assessed over two months, and inter-laboratory comparison was performed across CLIA-certified laboratory settings.
Analytical Notes
Linearity, limitations, and support
Page 3 of 3
Clinician support details
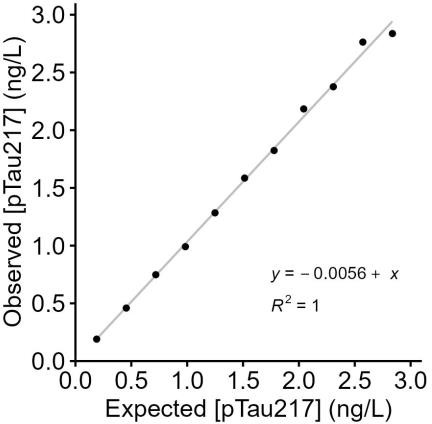
Figure 2. p-Tau217 admixture linearity
A pooled high sample was diluted into a healthy control sample to create 11 distinct levels. Each dilution was replicated and analyzed on a single instrument with one reagent lot under CLSI EP06-A guidance.
Limitations
Intended use is in adults aged 45 years and older with cognitive impairment who are being evaluated for Alzheimer's disease and other causes of cognitive decline.
Comorbid conditions may affect phosphorylated tau levels in blood, including hepatic or renal dysfunction, chronic kidney disease, stroke, myocardial infarction, and some medications that support kidney function.
Differences in results based on racial and ethnic background, sex, and age had not yet been fully established. Results from different p-Tau methods should not be used interchangeably.
Sample interference
Three plasma samples were tested with interferent and solvent-only controls to assess potential assay interference. Highest concentrations were bilirubin (500 µmol/L, conjugated and unconjugated), hemoglobin (6 mg/mL), biotin (20 mg/dL), and heterophilic antibodies (HAMA 1%) under CLSI EP07 guidance; no interference was observed.
Scan to review provider enrollment and offering details.
Ordering support
Visit alzbloodtest.com/for-providers for provider enrollment, workflow guidance, and implementation resources.
For account setup or program questions, contact support@alzbloodtest.com or call 1 (844) 259-8378.
Study attribution and regulatory note
This is a laboratory developed test (LDT) whose performance characteristics were established by the performing CLIA-certified laboratory.
The test has not been cleared or approved by the U.S. Food and Drug Administration. The performing laboratory is regulated under CLIA to perform high-complexity testing, and analytical and clinical performance were determined using CLSI-aligned methods.
References
2022 Alzheimer's disease facts and figures. Alzheimer's Dement. 2022 Apr;18(4):700-789. doi: 10.1002/alz.12638. Epub 2022 Mar 14.
Hansson O, et al. The Alzheimer's Association appropriate use recommendations for blood biomarkers in Alzheimer's disease. Alzheimer's Dement. 2022 Dec;18(12):2669-2686. doi: 10.1002/alz.12756. Epub 2022 Jul 31.
Ashton NJ, Brum WS, Di Molfetta G, et al. Diagnostic Accuracy of a Plasma Phosphorylated Tau 217 Immunoassay for Alzheimer Disease Pathology. JAMA Neurol. 2024 Mar 1;81(3):255-63.
Thijssen EH, et al. Association of Plasma P-tau217 and P-tau181 with clinical phenotype, neuropathology, and imaging markers in Alzheimer's disease and frontotemporal lobar degeneration: a retrospective diagnostic performance study. The Lancet. Neurology. 2021 Sep;20(9):739.
Mammel A, et al. Clinical decision points for two plasma p-tau217 laboratory developed tests in neuropathology confirmed samples. Alzheimer's & Dementia: Diagnosis, Assessment & Disease Monitoring. 2025 Jan;17(1):e70070.